What 28,771 survey questions tell us about what marketers actually want to know
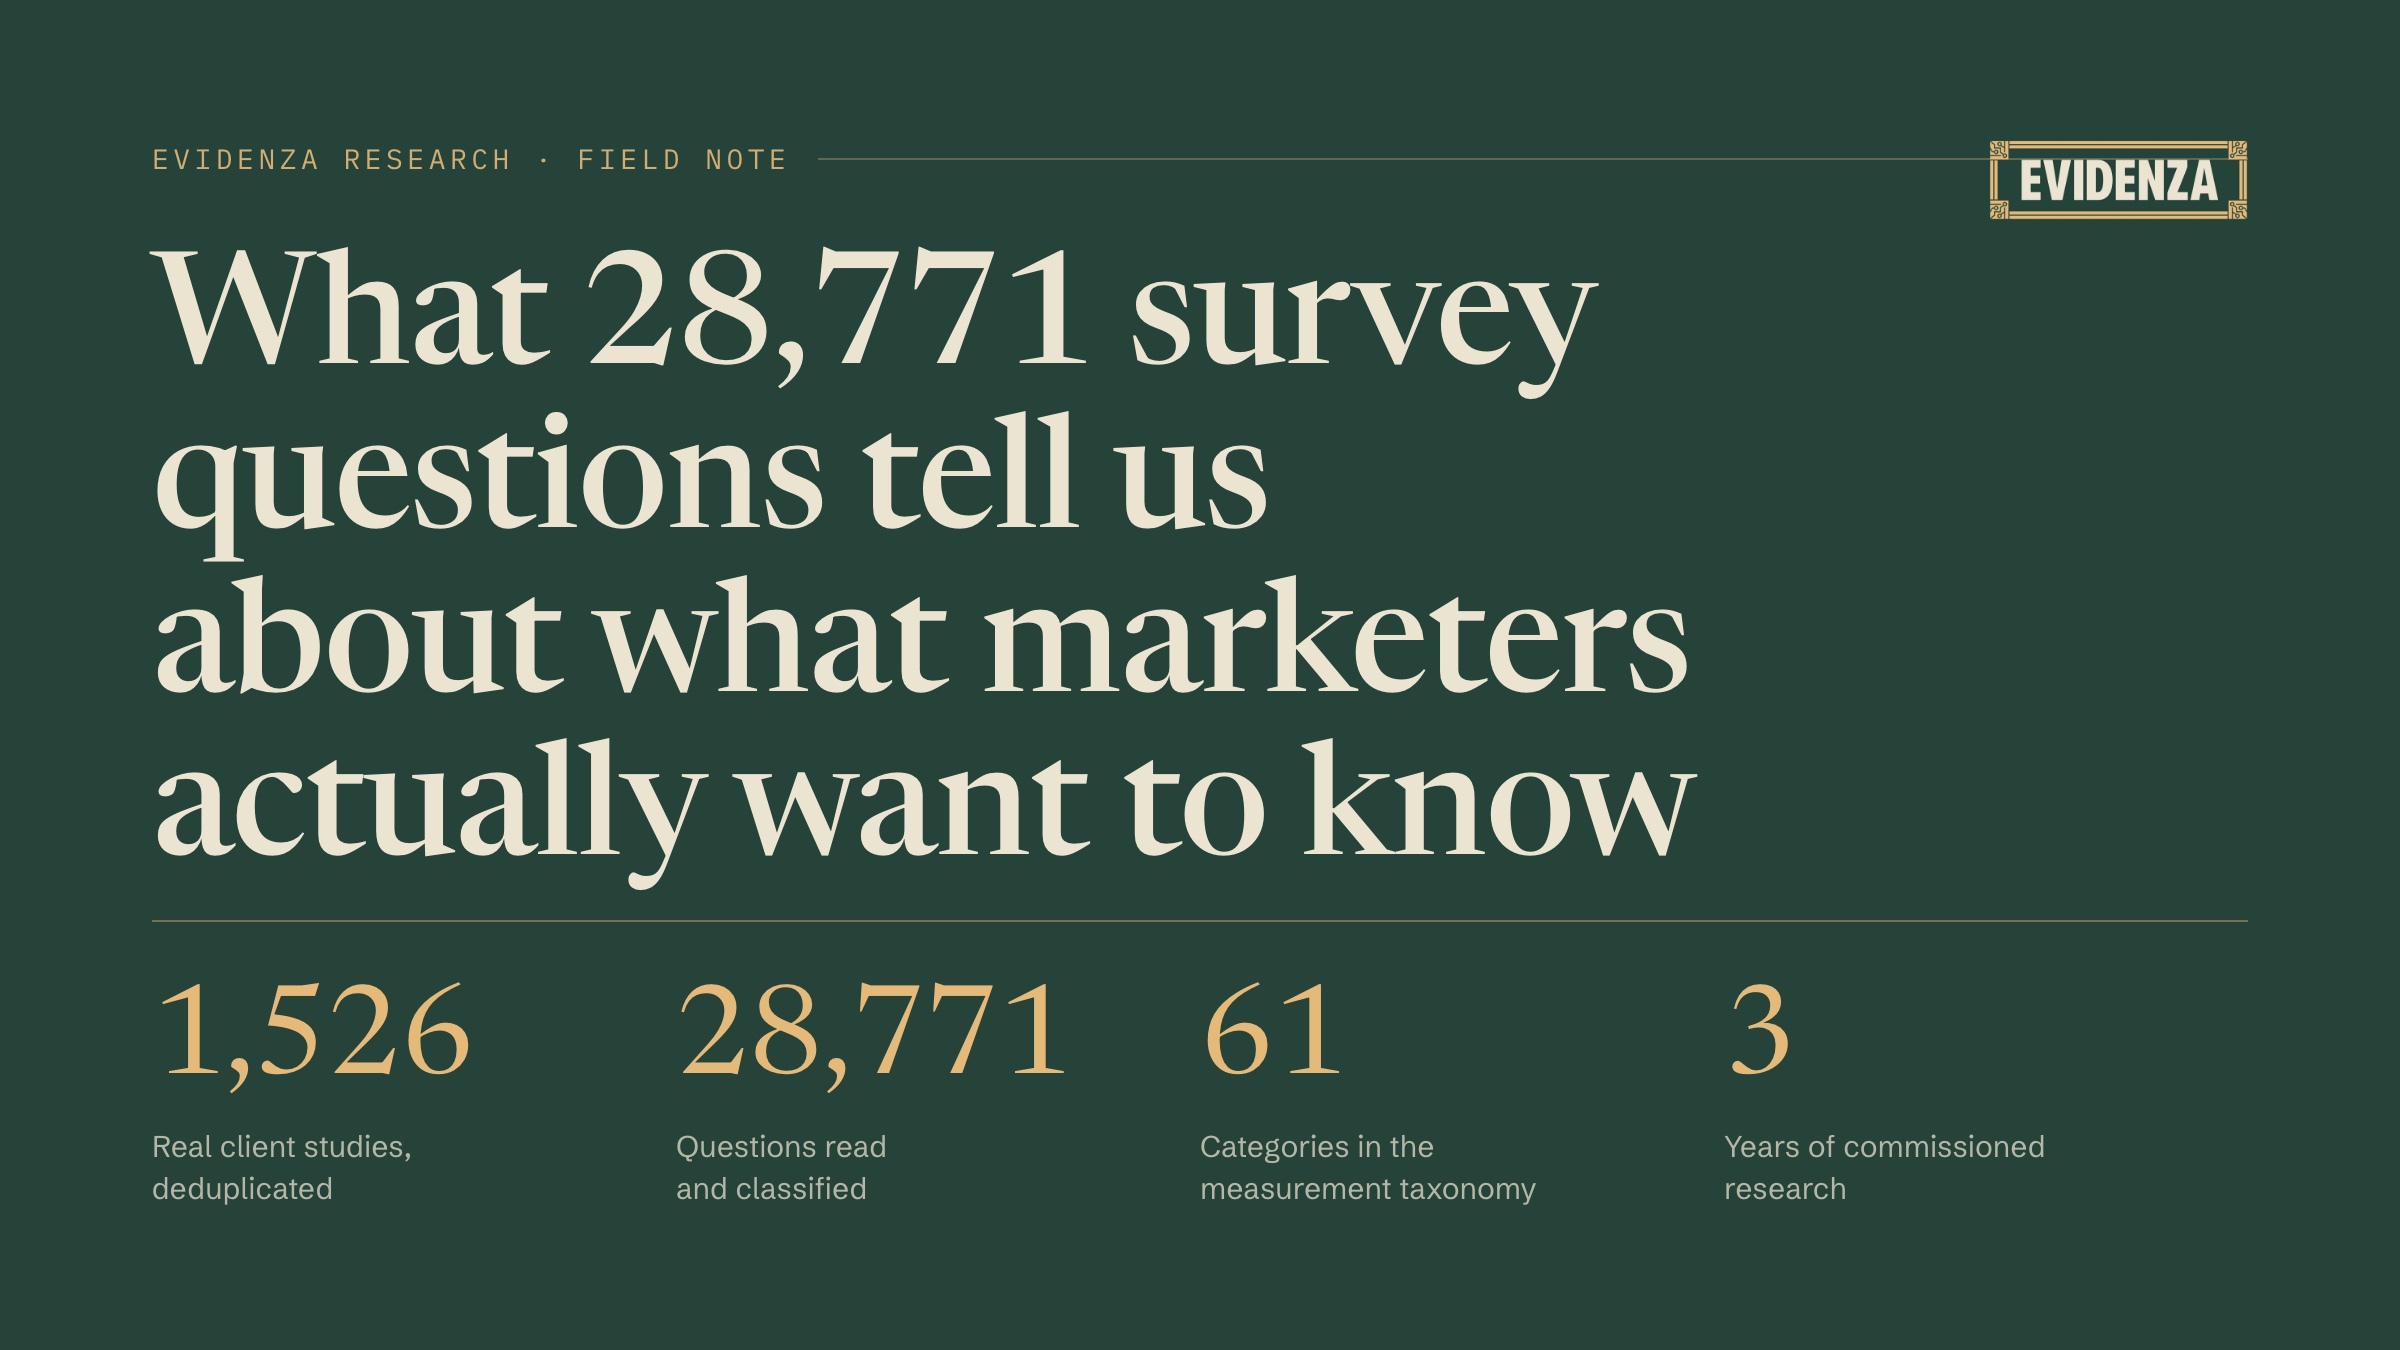
We read every question from 1,526 real client studies, three years of commissioned market research, and sorted all 28,771 of them into 61 categories. What comes out is a census of what companies actually pay research to find out. The top of the list isn’t what most people guess.
Takeaways
- The biggest thing clients buy is decision inputs, meaning “why do people choose?”, at 22.7% of all questions. Attribute importance alone accounts for 10.3%.
- Brand equity, the classic tracker material, comes second at 16.2%. Big, but not the center of gravity most people assume.
- Naming questions are the 9th most-asked category, with 888 questions. Companies test names far more often than the standard research menu suggests.
- Pricing shows up in 672 questions across 211 studies, but only 132 ask willingness to pay directly. Clients circle the price question rather than asking it.
The syllabus nobody publishes
Marketers ask us a version of the same question all the time: what is everyone else doing? Not in the trade-press sense. In the literal sense. When a company commissions research, what do they actually put on the questionnaire?
We can answer that now, because we went back and read everything. Over the past three years clients have run 1,526 distinct studies on our platform, which works out to 28,771 questions once you strip out the reruns and duplicate copies. We classified every one of them using a taxonomy our research team built: 61 categories describing what a question measures, rolled up into 13 groups, rolled up into 4 commercial jobs.
As far as we know, this is the first public census of what companies actually pay market research to do. And to be clear about what it isn’t: there are no accuracy numbers in this post. No scores, no verdicts on anyone’s methodology. It’s a count of what gets asked. The count alone rearranged how we think about the business.
The number one thing clients buy is “why”
The largest group of questions, 22.7% of everything asked, is what we call decision inputs. Questions about why people choose. What matters when they compare options, what stops them from buying, what would tip them over the line. More than one question in five is some version of “walk me through the decision.”
The single most-asked category in the whole corpus sits inside that group: attribute importance, or “which of these things matters most to you?” It accounts for 10.3% of all questions, 2,952 in total. Nothing else comes close. Barriers to purchase, the sibling question (“what’s stopping you?”), is the fifth most-asked category on its own, with 1,138 questions.
That surprised us. The stereotype of market research is the brand tracker: are people aware of us, do they like us, would they recommend us. Our data says the modal question is a lot more practical than that. Companies aren’t mainly paying to hear how they’re perceived. They’re paying to understand the machinery of choice.
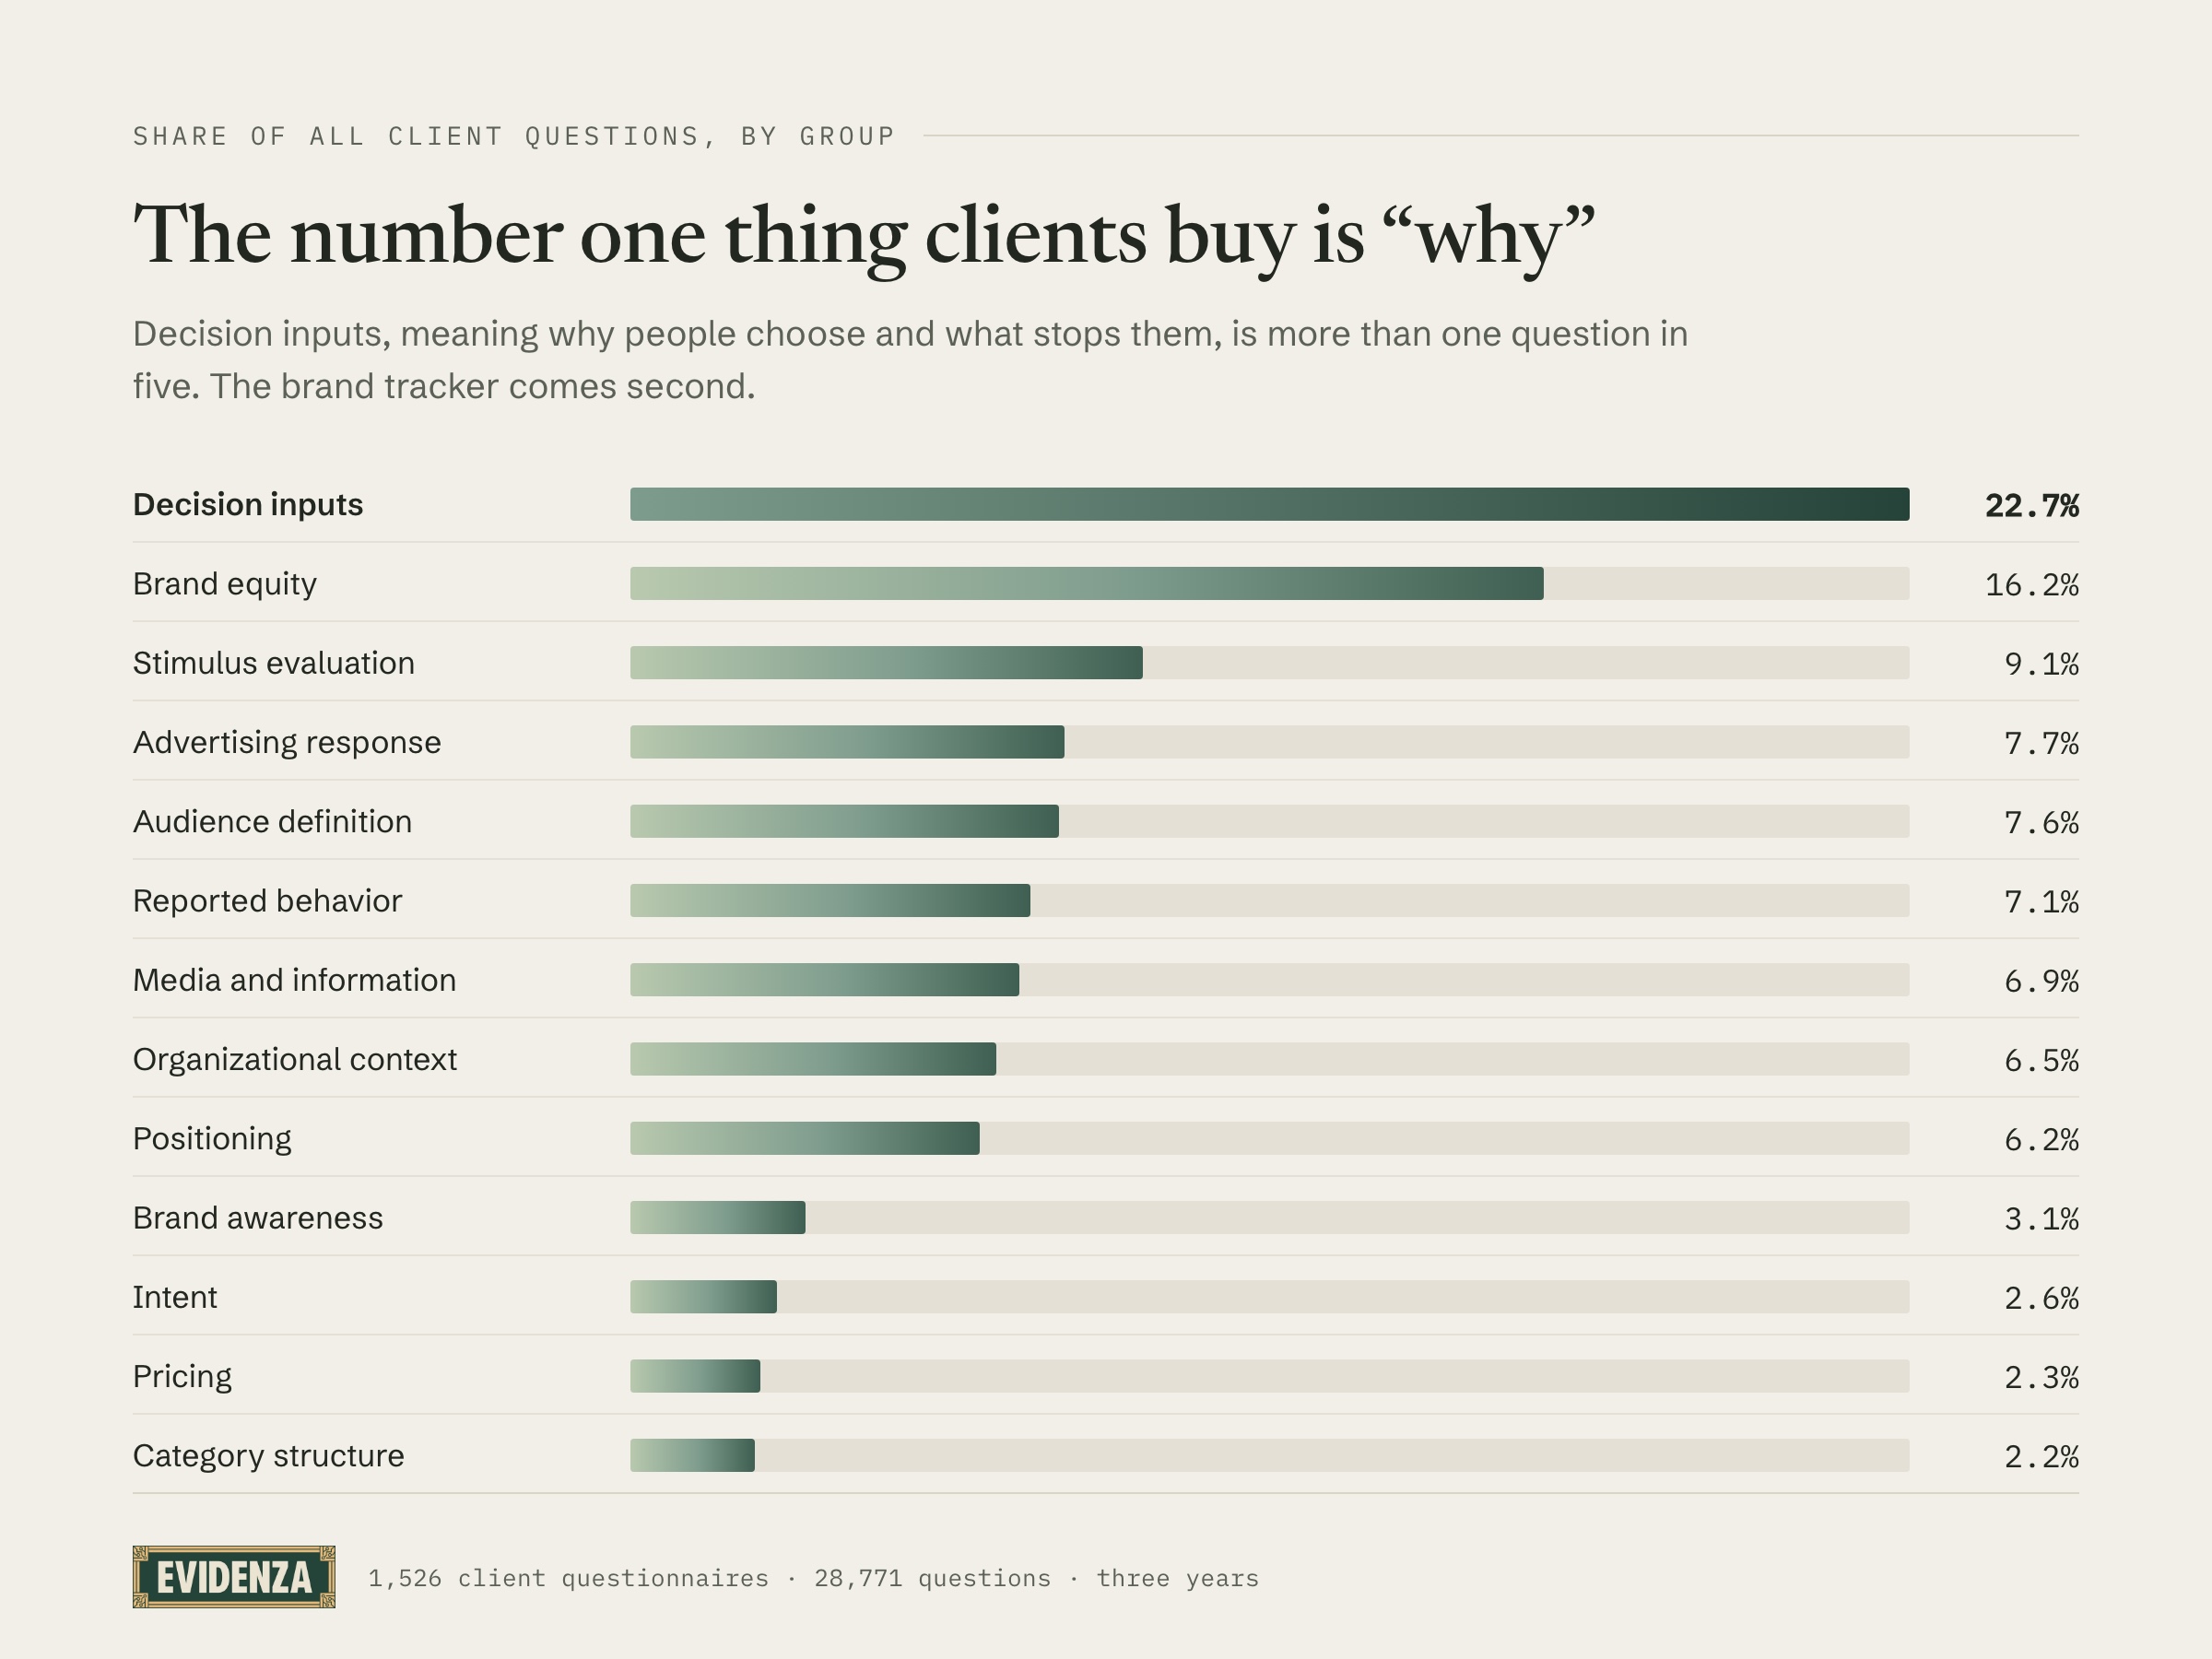
The most common question in commissioned research is not “do they know us?” or “do they like us?” It’s “why do they choose?”
The brand tracker comes second
Brand equity (perception, image, favorability, the classic tracker material) is the second-largest group at 16.2% of all questions. Still enormous, and brand perception is the second most-asked individual category at 6.5%. But it isn’t the center of gravity, and most people we show this to assume that it is.
Brand awareness is the sharper surprise. The metric behind arguably the most famous chart in marketing accounts for just 3.1% of what clients ask. The front door of the funnel gets a fraction of the attention that the decision behind it gets.
Four jobs, one heavy favorite
Every category rolls up into one of four commercial jobs, meaning the business decision the research is ultimately serving.
How To Win, the job of shaping the offer itself (what to claim, what to build, how to position, what to charge) takes 42.9% of all questions. That is by far the largest share. Where To Play, choosing markets and understanding category dynamics, takes 21.4%. Who To Serve, defining and understanding the audience, takes 21.1%, effectively tied with Where To Play. How To Activate, reaching people through media and channels and campaigns, takes 14.6%.
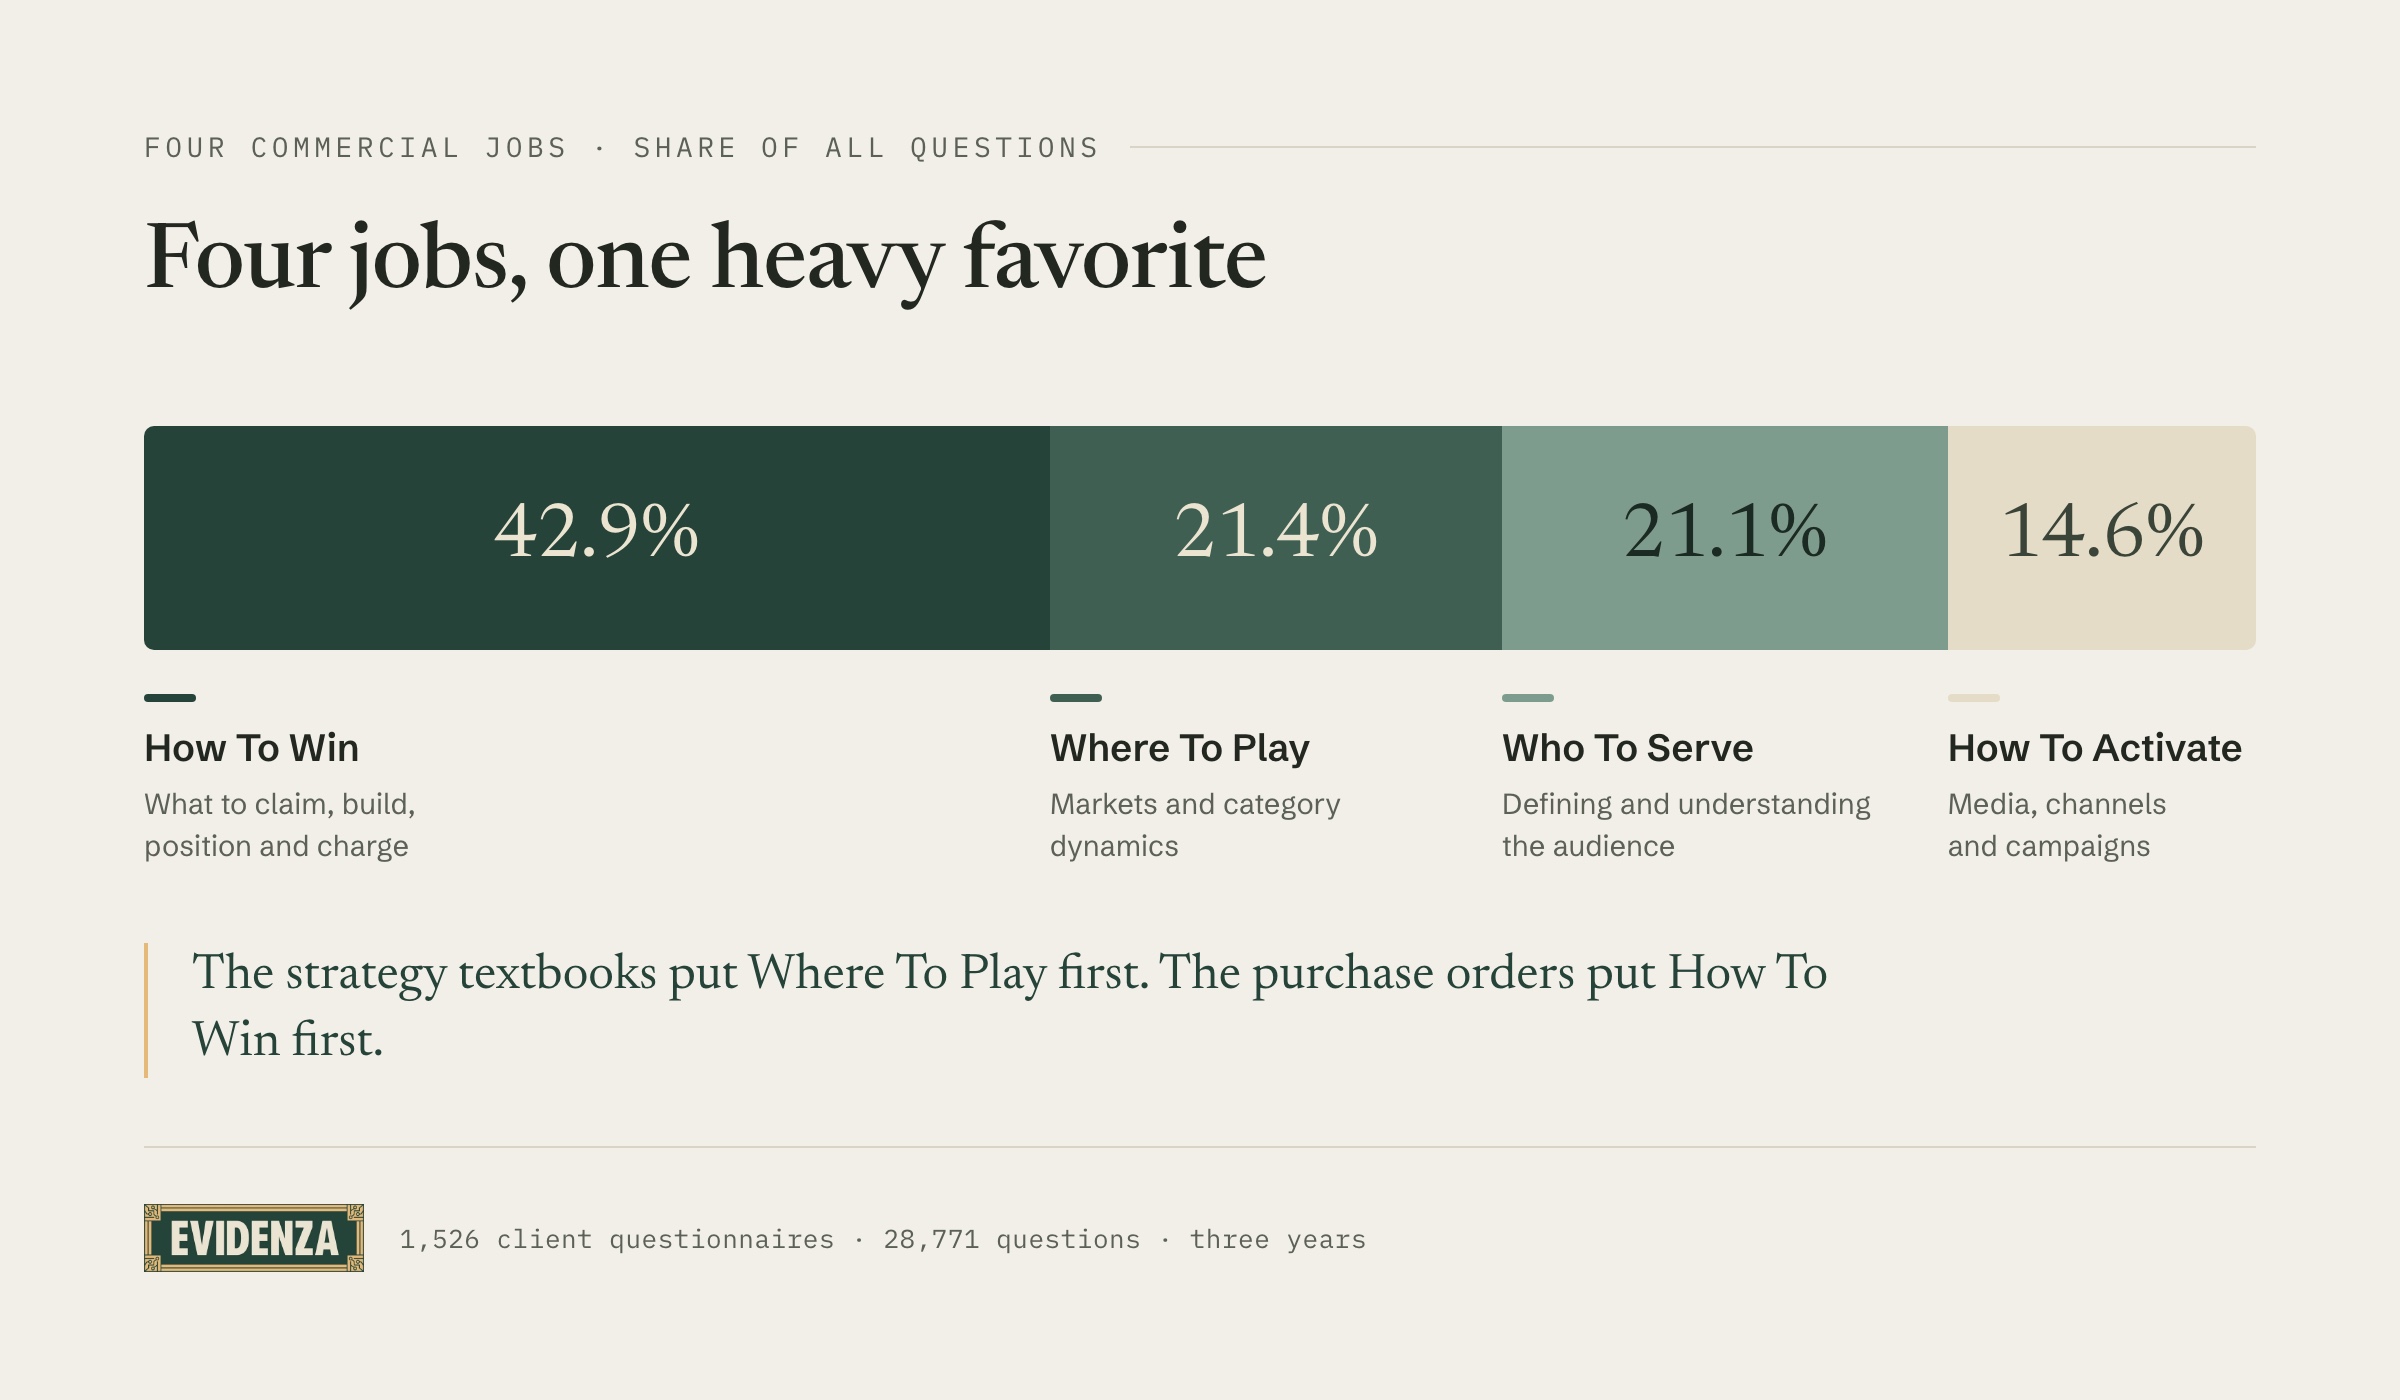
Put plainly: companies spend most of their research money on making the offer win, not on choosing where to compete or how to promote what they already have. The strategy textbooks put Where To Play first. The purchase orders put How To Win first.
The tails are where it gets interesting
Two findings further down the list stopped us.
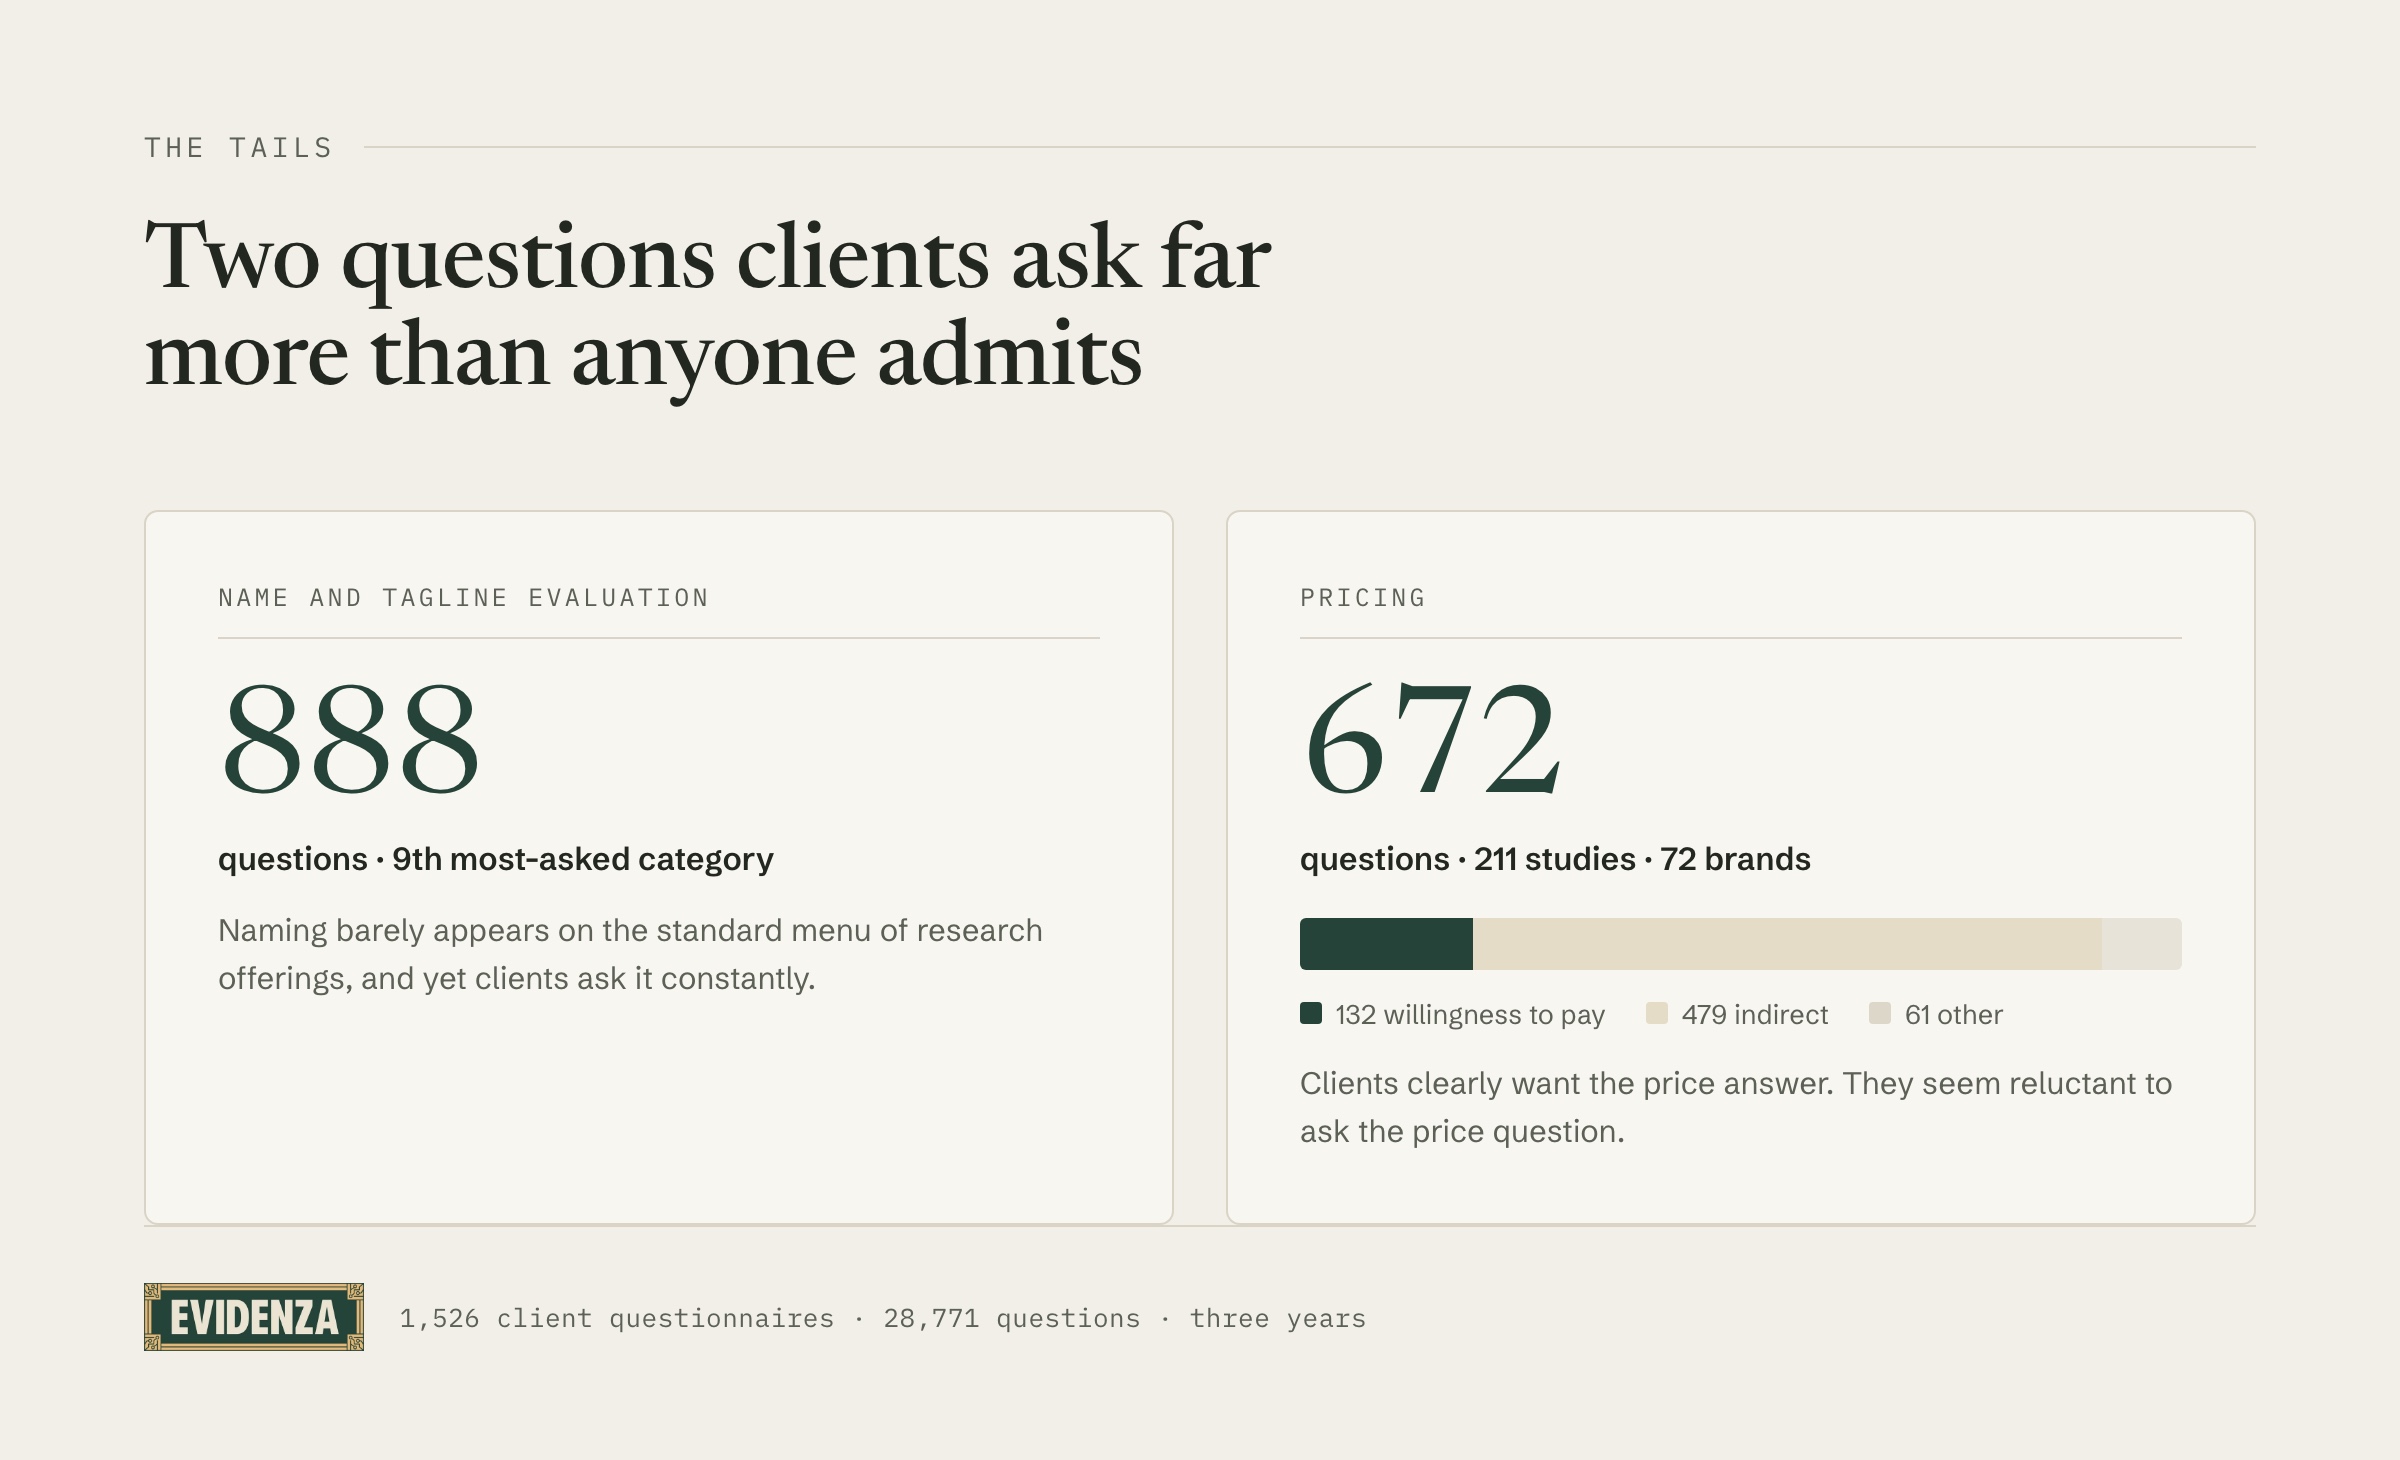
The first is naming. Name and tagline evaluation (“which of these names fits this product?”) is the 9th most-asked category in the corpus, with 888 questions. Naming barely appears on the standard menu of research offerings, and yet clients ask it constantly. If you have ever agonized over what to call something, you are in large company.
The second is pricing, which gets asked all the time and almost never directly. Pricing questions appear 672 times across 211 studies and 72 brands. Only 132 of those ask willingness to pay outright. The bulk, 479 questions, come at price from an angle: reactions to specific price points, value-for-money perceptions, trade-offs. Clients clearly want the price answer. They seem reluctant to ask the price question.
One note on the taxonomy itself: it held. All 61 categories show up somewhere in real client work, and only 7 questions out of 28,771 fit none of them. What marketers ask is diverse, but it isn’t infinite. Sixty-one names cover essentially all of it.
What a questionnaire actually looks like
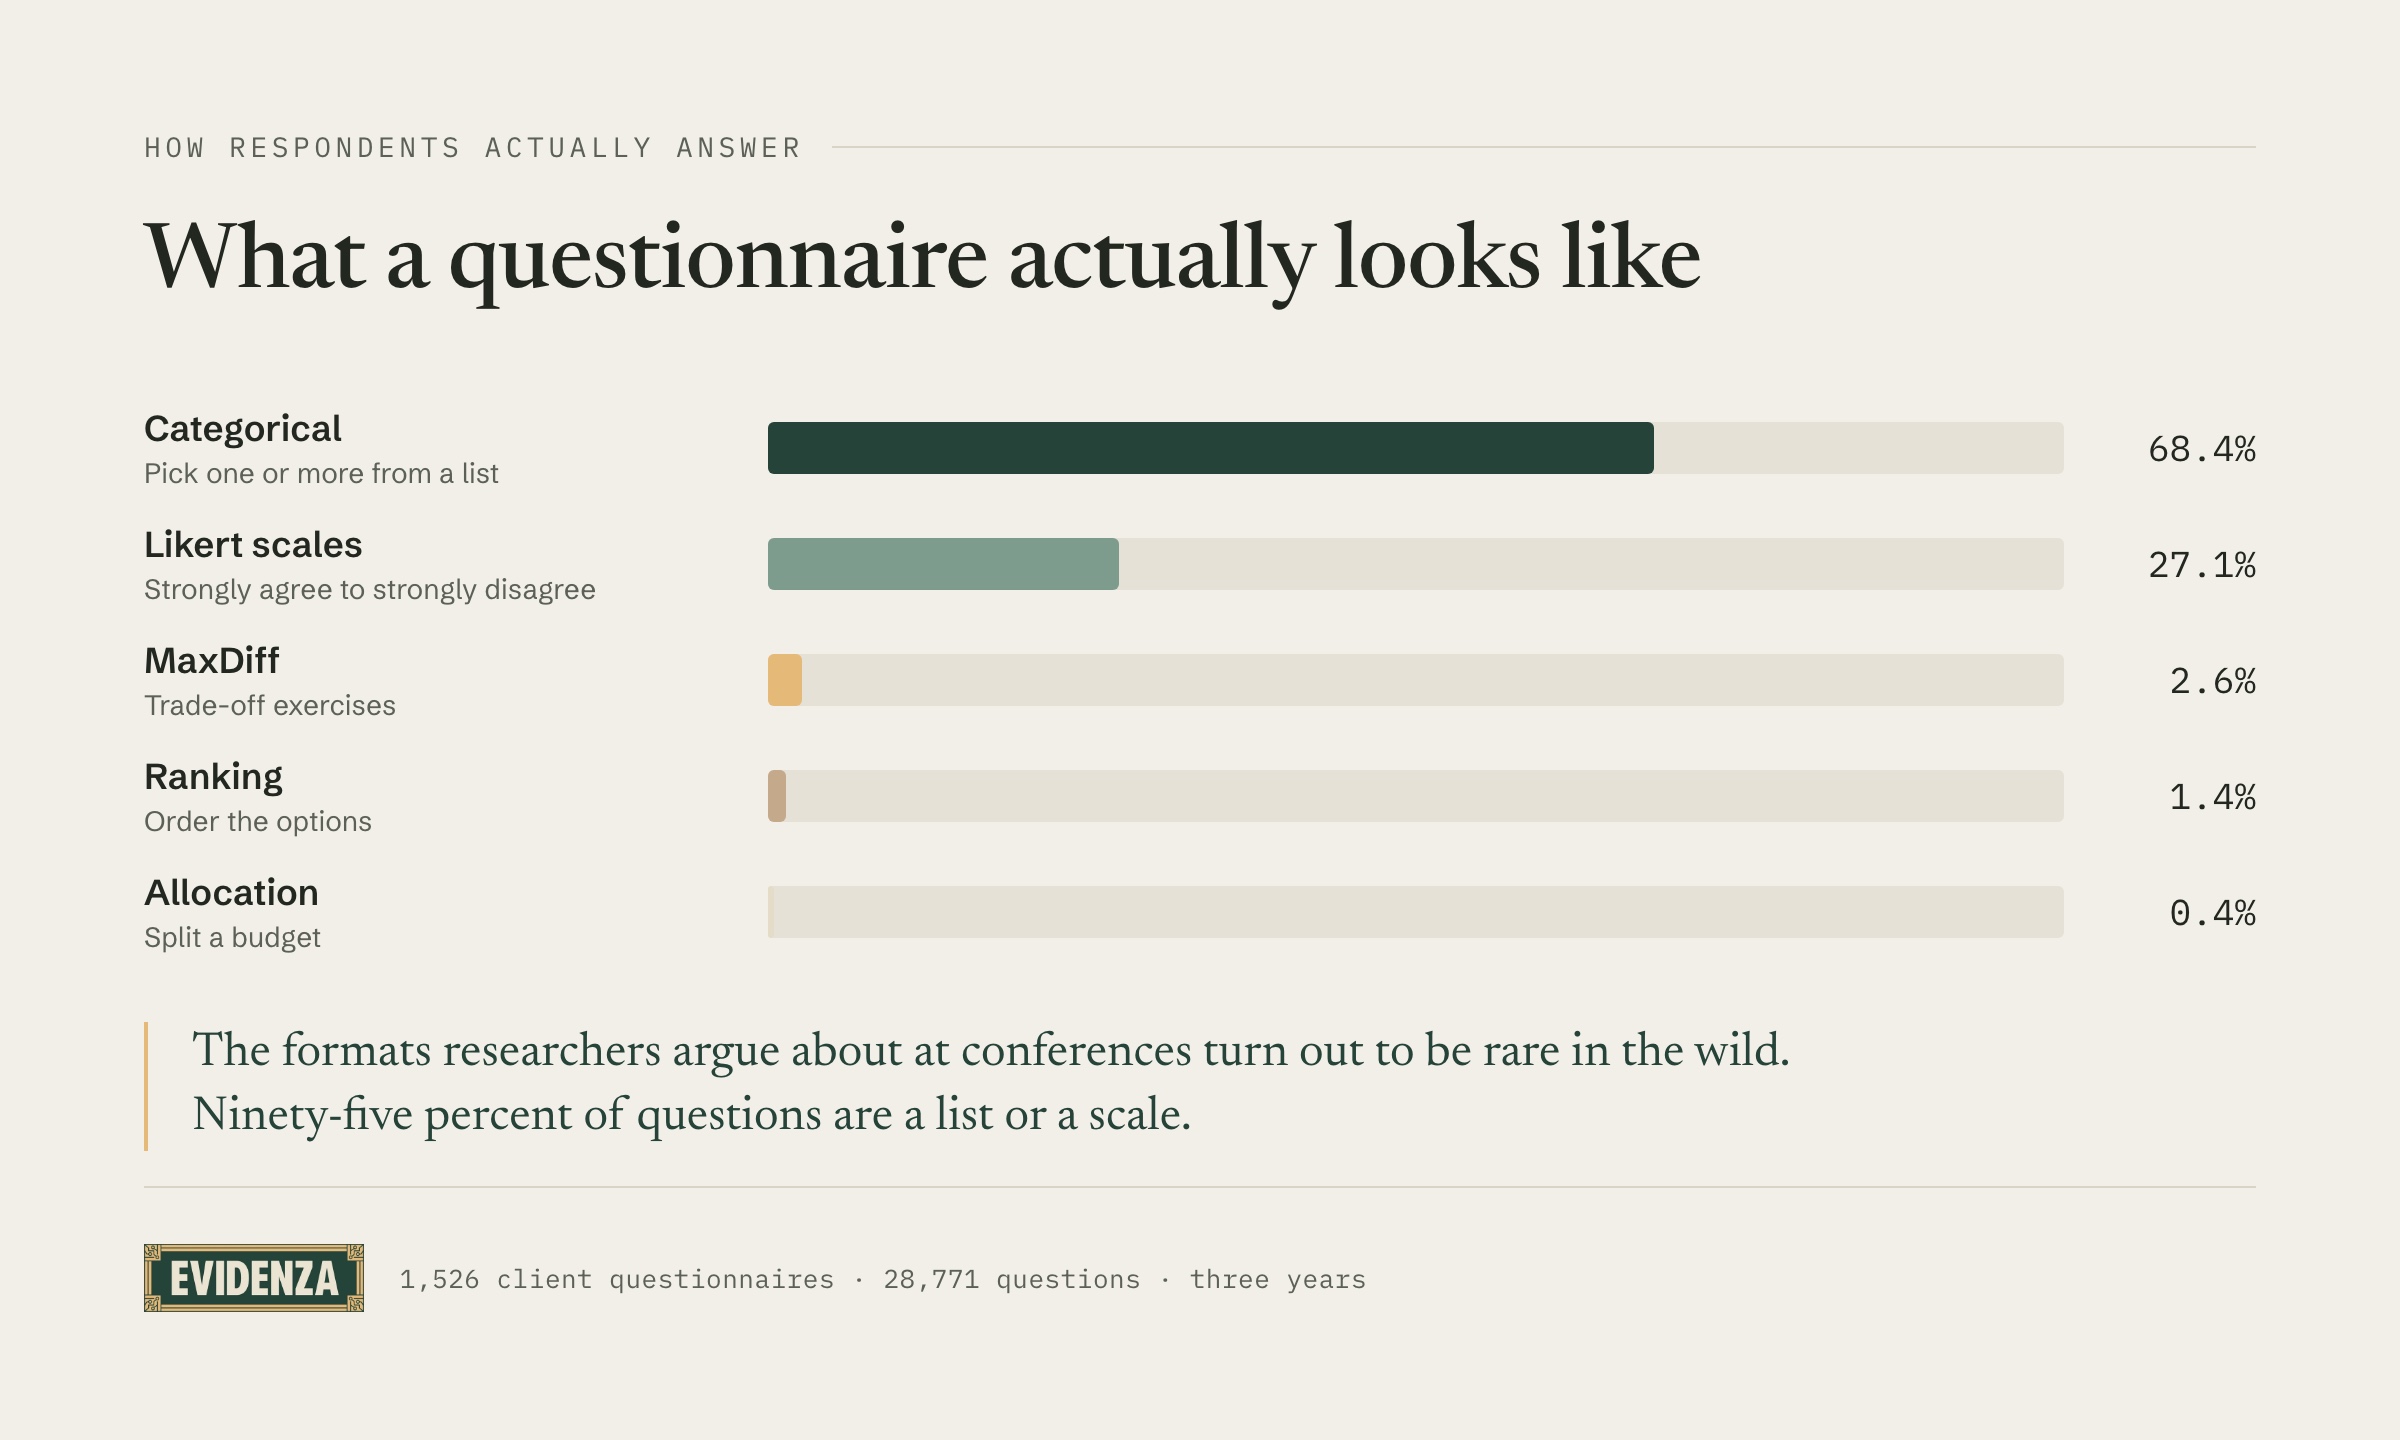
A different cut, not what a question measures but how the respondent answers it. Here the corpus is plainer than the category list suggests. 68.4% of questions are categorical: pick one or more options from a list. Another 27.1% are Likert-type rating scales, the “strongly agree” to “strongly disagree” family. The formats researchers argue about at conferences turn out to be rare in the wild. MaxDiff trade-off exercises are 2.6% of questions, ranking is 1.4%, and budget allocation questions are 0.4%.
The studies themselves are compact. The median questionnaire runs 16 questions. The longest runs 75. Across the corpus, 373 distinct brands were studied.
Why we counted
This taxonomy is now the vocabulary we use for everything, including grading ourselves. Evidenza runs synthetic research: surveys answered by AI-simulated respondents instead of human panels. The obvious question about every category above is the one you are probably already asking, which is how well a synthetic panel can actually answer it.
We test that continuously by running the same questions on synthetic panels and on real human samples, then comparing the results category by category. That work is the rest of this series: where synthetic research holds up, where it falls short, and how we measure the difference honestly, including the misses.
This census is step one because it tells us which categories matter most. Being good at a rare question is worth a lot less than being good at the thing clients ask 2,952 times.
How we did this
The counting unit is the deduplicated questionnaire. Clients rerun studies, and internal tests get run dozens of times, so raw report counts overstate demand. 2,743 report runs collapse to 1,526 distinct questionnaires once we fingerprint them on their question text, meaning 44% were duplicate copies. A study rerun 40 times counts once.
Classification was done by a large language model reading each questionnaire whole and assigning every question one of 61 categories from a closed list. The taxonomy was built with our research team. The unit of judgment is the survey rather than the lone question, because “are you familiar with X?” means different things at different points in a funnel, and only the surrounding questionnaire disambiguates it.
Three honest limits. The labels are one model’s judgment, internally consistent but not adjudicated against a human-labeled answer key. The counts describe demand, not quality: nothing here says whether any of these questions got a good answer, from us or anyone else. And the corpus is our client base over three years, not a probability sample of the industry. Read it as a large real window, not a census of all research everywhere.
.png)